"""bioat.lib.libplot.
author: Herman Huanan Zhao
email: hermanzhaozzzz@gmail.com
homepage: https://github.com/hermanzhaozzzz
This module provides functions for plotting.
example 1:
init_matplotlib
<in python consolo>:
>>> import matplotlib.pyplot as plt
>>> from bioat.lib.libplot import init_matplotlib
>>> init_matplotlib(log_level="info")
>>> plt.plot([1, 2, 3], [4, 5, 6])
>>> plt.show()
example 2:
plot_colortable
<in python consolo>:
>>> from bioat.lib.libplot import plot_colortable
>>> colors = ["#64C1E8", "#80CED7", "#63C7B2", "#8E6C88", "#CA61C3", "#FF958C", "#883677"]
>>> plot_colortable(colors, ncols=1, labels=[1, 2, 3, 4, 5, 6, 7])
>>> plt.show()
"""
import math
import os
import re
import shutil
import sys
from glob import glob
import pandas as pd
from bioat.exceptions import BioatError, BioatRuntimeError
from bioat.lib.libpath import HOME
from bioat.logger import LoggerManager
lm = LoggerManager(mod_name="bioat.lib.libplot")
__all__ = ["init_matplotlib", "plot_colortable"]
BIOAT_DEFAULT_FONTS_DATAPATH = os.path.join(os.path.dirname(__file__), "libplot")
BIOAT_DEFAULT_FONTS = [
"Helvetica-Bold.ttf",
"Helvetica-BoldOblique.ttf",
"Helvetica-Light.ttf",
"Helvetica-Oblique.ttf",
"Helvetica.ttf",
]
BIOAT_MORANDI_PALETTE = (
"#8FA58E",
"#8BA4B8",
"#C8B6A6",
"#B4867A",
"#A792A6",
"#D0C2A4",
"#A7B6A3",
"#7D8C99",
)
_MATH_TITLE_TOKEN_RE = re.compile(r"\$([^$]+)\$")
_SIMPLE_SCRIPT_RE = re.compile(r"^([_^])(?:\{([^{}\\]+)\}|([^{}\\]))$")
def _load_plot_modules():
import matplotlib.pyplot as plt
import seaborn as sns
from matplotlib.patches import Rectangle
return plt, sns, Rectangle
def _copy_fonts(refresh=False, log_level="warning"):
"""Copy fonts from bioat package to matplotlib package.
:param log_level: log level for logger
:type log_level: string
:raises FileNotFoundError: if not found which site-packages to copy fonts to
"""
lm.set_names(func_name="_copy_fonts")
lm.set_level(log_level)
if refresh:
files_to_remove = glob(os.path.join(HOME, ".cache", "matplotlib", "fontlist*"))
for file in files_to_remove:
os.remove(file)
try:
to_path = None
for i in sys.path:
if i.endswith("site-packages"):
to_path = i
break
if not to_path:
lm.logger.warning(BioatRuntimeError("site-packages not found in sys.path"))
return
to_path = next(i for i in sys.path if i.endswith("site-packages"))
to_path = os.path.join(
to_path,
"matplotlib",
"mpl-data",
"fonts",
"ttf",
)
from_path = BIOAT_DEFAULT_FONTS_DATAPATH
lm.logger.debug(f"Copying fonts from {from_path} to {to_path}")
for font in BIOAT_DEFAULT_FONTS:
shutil.copyfile(
os.path.join(from_path, font),
os.path.join(to_path, font),
)
lm.logger.debug("Fonts copied successfully")
except Exception as e:
lm.logger.exception(BioatError(f"Failed to copy fonts: {e}"))
def _parse_simple_script_title(label):
chunks = []
pos = 0
matched_script = False
for match in _MATH_TITLE_TOKEN_RE.finditer(label):
if match.start() > pos:
chunks.append(("text", label[pos : match.start()]))
body = match.group(1)
if "\\" in body:
return None
script_match = _SIMPLE_SCRIPT_RE.fullmatch(body)
if script_match is None:
return None
script_mark, braced_text, single_char = script_match.groups()
script_text = braced_text if braced_text is not None else single_char
chunks.append(("sub" if script_mark == "_" else "sup", script_text))
matched_script = True
pos = match.end()
if pos < len(label):
chunks.append(("text", label[pos:]))
if not matched_script:
return None
return chunks
def _patch_simple_script_titles():
"""Render simple title superscripts/subscripts as editable text chunks."""
from matplotlib import rcParams
from matplotlib.axes import Axes
from matplotlib.offsetbox import AnchoredOffsetbox, DrawingArea, HPacker, TextArea, VPacker
if getattr(Axes.set_title, "_bioat_simple_script_title_patch", False):
return False
original_set_title = Axes.set_title
def set_title_with_simple_scripts(
self,
label,
fontdict=None,
loc=None,
pad=None,
*,
y=None,
**kwargs,
):
previous_artist = getattr(self, "_bioat_simple_script_title_artist", None)
if previous_artist is not None:
try:
previous_artist.remove()
except ValueError:
pass
self._bioat_simple_script_title_artist = None
chunks = _parse_simple_script_title(label) if isinstance(label, str) else None
if chunks is None or loc not in (None, "center"):
return original_set_title(
self,
label,
fontdict=fontdict,
loc=loc,
pad=pad,
y=y,
**kwargs,
)
textprops = {}
if fontdict:
textprops.update(fontdict)
textprops.update(kwargs)
textprops.setdefault("fontsize", rcParams["axes.titlesize"])
textprops.setdefault("fontweight", rcParams["axes.titleweight"])
textprops.setdefault("color", rcParams["text.color"])
script_props = textprops.copy()
fontsize = textprops.get("fontsize", rcParams["axes.titlesize"])
script_offset = 1.5
if isinstance(fontsize, (int, float)):
script_props["fontsize"] = fontsize * 0.7
script_offset = max(fontsize * 0.2, 1.0)
children = []
for kind, text in chunks:
if not text:
continue
if kind == "text":
children.append(TextArea(text, textprops=textprops))
elif kind == "sub":
children.append(
VPacker(
children=[
DrawingArea(0, script_offset),
TextArea(text, textprops=script_props),
],
align="left",
pad=0,
sep=0,
)
)
elif kind == "sup":
children.append(
VPacker(
children=[
TextArea(text, textprops=script_props),
DrawingArea(0, script_offset),
],
align="left",
pad=0,
sep=0,
)
)
if not children:
return original_set_title(
self,
label,
fontdict=fontdict,
loc=loc,
pad=pad,
y=y,
**kwargs,
)
title_box = HPacker(children=children, align="baseline", pad=0, sep=0)
anchor_y = 1.02 if y is None else y
anchored_title = AnchoredOffsetbox(
loc="upper center",
child=title_box,
pad=0,
borderpad=0,
frameon=False,
bbox_to_anchor=(0.5, anchor_y),
bbox_transform=self.transAxes,
)
self.add_artist(anchored_title)
self._bioat_simple_script_title_artist = anchored_title
return original_set_title(
self,
"",
fontdict=fontdict,
loc=loc,
pad=pad,
y=y,
**kwargs,
)
set_title_with_simple_scripts._bioat_simple_script_title_patch = True
set_title_with_simple_scripts._bioat_original_set_title = original_set_title
Axes.set_title = set_title_with_simple_scripts
return True
def _unpatch_simple_script_titles():
from matplotlib.axes import Axes
original_set_title = getattr(
Axes.set_title,
"_bioat_original_set_title",
None,
)
if original_set_title is None:
return False
Axes.set_title = original_set_title
return True
[docs]
def init_matplotlib(
font="Helvetica",
refresh=False,
sns_context="paper",
sns_style="white",
sns_palette=BIOAT_MORANDI_PALETTE,
sns_font_scale=1.0,
figure_dpi=300,
log_level="INFO",
**kwargs,
):
"""Easily set matplotlib style.
:param font: use what font in matplotlib, defaults to 'Helvetica'
:type font: str, optional
:param refresh: whether to remove matplotlib font cache and reload bundled fonts, defaults to False
:type refresh: bool, optional
:param sns_context: seaborn context, defaults to 'paper'
:type sns_context: str, optional
:param sns_style: seaborn style, defaults to 'white'
:type sns_style: str, optional
:param sns_palette: seaborn palette, defaults to a muted Morandi palette
:type sns_palette: str or sequence, optional
:param sns_font_scale: seaborn font scale, defaults to 1.0
:type sns_font_scale: float, optional
:param figure_dpi: default figure resolution, defaults to 300
:type figure_dpi: int, optional
:param log_level: log level, defaults to 'INFO'
:type log_level: str, optional
:raises BioatError: if failed to copy fonts
:raises BioatRuntimeError: if site-packages not found in sys.path
"""
lm.set_names(func_name="init_matplotlib")
lm.set_level(log_level)
plt, sns, _ = _load_plot_modules()
# Keep rarely changed knobs in kwargs so the public signature stays simple.
style = kwargs.get("style", "seaborn-v0_8-white")
# Use ASCII hyphen-minus for negative ticks; some font imports
# render the Unicode minus as a missing glyph or question mark.
axes_unicode_minus = kwargs.get("axes_unicode_minus", False)
# Primary vector-editing requirement: keep words grouped as editable text.
# Core PDF/PS fonts import more consistently as word-level text boxes; the
# simple-subscript title patch avoids mathtext Type 3 glyph paths there.
pdf_use14corefonts = kwargs.get("pdf_use14corefonts", True)
ps_useafm = kwargs.get("ps_useafm", True)
split_simple_math_titles = kwargs.get("split_simple_math_titles", True)
set_backend_svg = kwargs.get("set_backend_svg", "none")
lm.logger.info("Initializing matplotlib")
_copy_fonts(refresh=refresh, log_level=log_level)
if split_simple_math_titles:
_patch_simple_script_titles()
else:
_unpatch_simple_script_titles()
lm.set_names(func_name="init_matplotlib")
lm.set_level(log_level)
lm.logger.info(
f"set: plt.style.use('{style}')\n"
"# set matplotlib style theme\n"
"# ref: https://matplotlib.org/stable/api/style_api.html",
)
plt.style.use(style)
lm.logger.info(f"set: plt.rcParams['font.family'] = '{font}'")
plt.rcParams["font.family"] = font
lm.logger.info(f"set: plt.rcParams['font.sans-serif'] = ['{font}']")
plt.rcParams["font.sans-serif"] = [font]
# 300 dpi is a safe publication default; final figure dimensions should
# still be controlled by figsize, usually width ~= 7 inches.
lm.logger.info(f"set: plt.rcParams['figure.dpi'] = {figure_dpi}")
plt.rcParams["figure.dpi"] = figure_dpi
lm.logger.info(
f"set: plt.rcParams['axes.unicode_minus'] = {axes_unicode_minus}",
)
plt.rcParams["axes.unicode_minus"] = axes_unicode_minus
lm.logger.info(
f"set: plt.rcParams['pdf.use14corefonts'] = {pdf_use14corefonts} \n"
"# use core fonts so vector editors keep words grouped as text\n"
"# ref: https://matplotlib.org/stable/api/matplotlib_configuration_api.html#matplotlib.rcParams)",
)
plt.rcParams["pdf.use14corefonts"] = pdf_use14corefonts
lm.logger.info(
f"set: plt.rcParams['ps.useafm'] = {ps_useafm}\n"
"# use AFM core fonts so vector editors keep words grouped as text",
)
plt.rcParams["ps.useafm"] = ps_useafm
if set_backend_svg:
lm.logger.info(
f"set: plt.rcParams['svg.fonttype'] = '{set_backend_svg}'\n"
"# whether to use 'none' to replace 'path' (use font but not plot path for characters)for the SVG backend",
)
plt.rcParams["svg.fonttype"] = set_backend_svg
lm.logger.info("matplotlib initialized successfully")
sns.set_theme(
context=sns_context,
style=sns_style,
palette=sns_palette,
font=font,
font_scale=sns_font_scale,
)
lm.logger.info(
f"set: sns.set_theme(context='{sns_context}', style='{sns_style}', palette='{sns_palette}', font='{font}', font_scale={sns_font_scale})",
)
lm.logger.info(
"Run this for publication figures: "
"fig, ax = plt.subplots(figsize=(7, height), dpi=300) "
"# replace height with the panel layout height",
)
[docs]
def plot_colortable(colors, *, ncols=4):
plt, _, Rectangle = _load_plot_modules()
cell_width = 212
cell_height = 22
swatch_width = 48
margin = 12
names = list(colors)
n = len(names)
nrows = math.ceil(n / ncols)
width = cell_width * 4 + 2 * margin
height = cell_height * nrows + 2 * margin
dpi = 72
fig, ax = plt.subplots(figsize=(width / dpi, height / dpi), dpi=dpi)
fig.subplots_adjust(
margin / width,
margin / height,
(width - margin) / width,
(height - margin) / height,
)
ax.set_xlim(0, cell_width * 4)
ax.set_ylim(cell_height * (nrows - 0.5), -cell_height / 2.0)
ax.yaxis.set_visible(False)
ax.xaxis.set_visible(False)
ax.set_axis_off()
for i, name in enumerate(names):
row = i % nrows
col = i // nrows
y = row * cell_height
swatch_start_x = cell_width * col
text_pos_x = cell_width * col + swatch_width + 7
ax.text(
text_pos_x,
y,
name,
fontsize=14,
horizontalalignment="left",
verticalalignment="center",
)
ax.add_patch(
Rectangle(
xy=(swatch_start_x, y - 9),
width=swatch_width,
height=18,
facecolor=name,
edgecolor="0.7",
),
)
plt.show()
plt.close()
def set_figsize(figsize=(3.5, 2.5)):
"""Set the figure size for matplotlib.
Defined in :numref:`sec_calculus`
"""
# use_svg_display()
plt, _, _ = _load_plot_modules()
plt.rcParams["figure.figsize"] = figsize
def set_axes(axes, xlabel, ylabel, xlim, ylim, xscale, yscale, legend):
"""Set the axes for matplotlib.
Defined in :numref:`sec_calculus`
"""
axes.set_xlabel(xlabel)
axes.set_ylabel(ylabel)
axes.set_xscale(xscale)
axes.set_yscale(yscale)
axes.set_xlim(xlim)
axes.set_ylim(ylim)
if legend:
axes.legend(legend)
axes.grid()
def plot(
X,
Y=None,
xlabel=None,
ylabel=None,
legend=None,
xlim=None,
ylim=None,
xscale="linear",
yscale="linear",
fmts=("-", "m--", "g-.", "r:"),
figsize=(3.5, 2.5),
axes=None,
):
"""Plot data points.
Defined in :numref:`sec_calculus`
"""
if legend is None:
legend = []
plt, _, _ = _load_plot_modules()
def has_one_axis(X): # True if X (tensor or list) has 1 axis
return (hasattr(X, "ndim") and X.ndim == 1) or (
isinstance(X, list) and not hasattr(X[0], "__len__")
)
if has_one_axis(X):
X = [X]
if Y is None:
X, Y = [[]] * len(X), X
elif has_one_axis(Y):
Y = [Y]
if len(X) != len(Y):
X = X * len(Y)
set_figsize(figsize)
if axes is None:
axes = plt.gca()
axes.cla()
for x, y, fmt in zip(X, Y, fmts, strict=False):
axes.plot(x, y, fmt) if len(x) else axes.plot(y, fmt)
set_axes(axes, xlabel, ylabel, xlim, ylim, xscale, yscale, legend)
# return axes
def plot_dna_features(
df: pd.DataFrame | None = None,
use_demo_data=True,
fig_width=10,
fig_height=2,
col_locus_start="locus_start",
col_locus_length="locus_length",
col_group="group",
col_name="name",
col_start="start",
col_end="end",
col_strand="strand",
col_color="color",
**kwargs,
):
# """
# 
# ==================== DEMO ====================
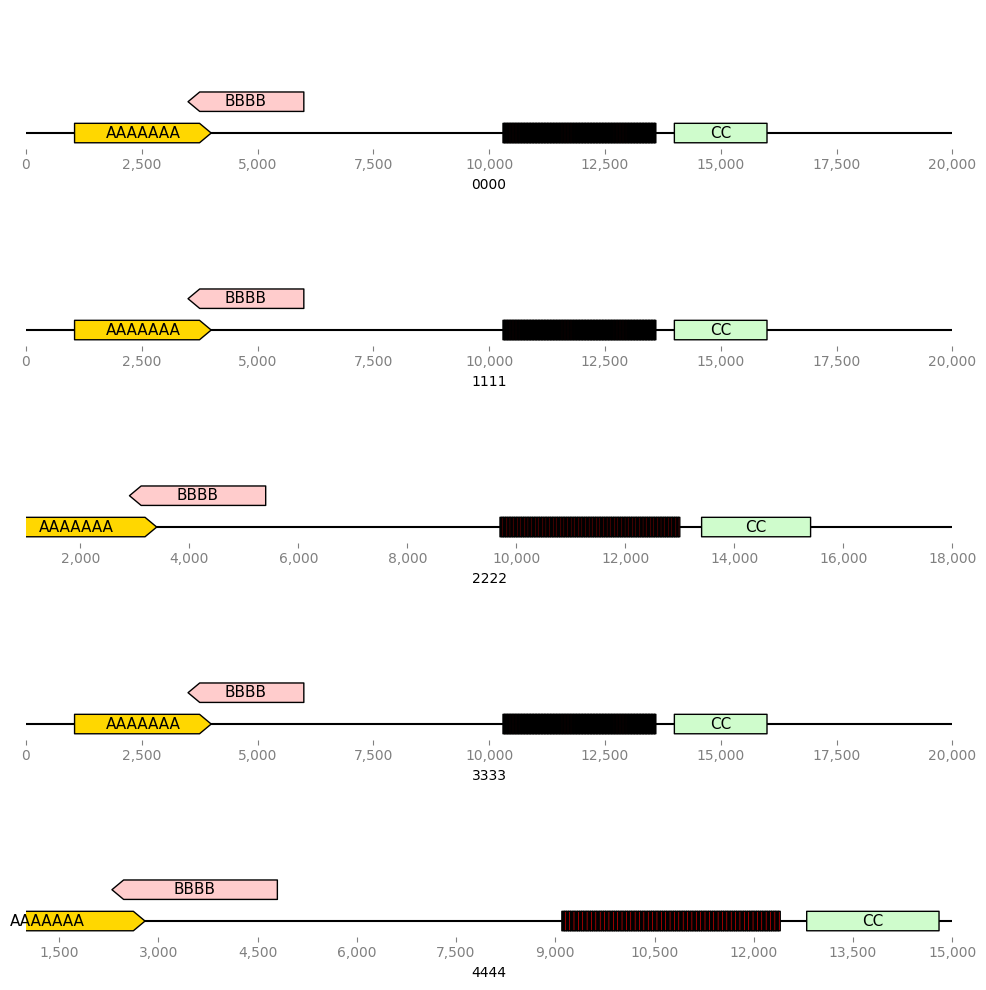
# group name type start end strand color locus_length locus_start
# 0 0000 AAAAAAA CDS 1050 4000 1.0 #ffd700 20000 0
# 1 0000 BBBB CDS 3500 6000 -1.0 #ffcccc 20000 0
# 2 0000 CC CDS 14000 16000 NaN #cffccc 20000 0
# 3 0000 None DR 10300 10336 NaN black 20000 0
# 4 0000 None DR 10366 10402 NaN black 20000 0
# .. ... ... ... ... ... ... ... ... ...
# 510 4444 None spacer 12106 12136 NaN red 14000 1000
# 511 4444 None spacer 12172 12202 NaN red 14000 1000
# 512 4444 None spacer 12238 12268 NaN red 14000 1000
# 513 4444 None spacer 12304 12334 NaN red 14000 1000
# 514 4444 None spacer 12370 12400 NaN red 14000 1000
# [515 rows x 9 columns]
# ==================== /DEMO ====================
# """
def _get_demo_data():
"""Get demo data for DNA features.
:return: demo DNA features
:rtype: pd.DataFrame
"""
df = pd.DataFrame(
{
"name": ["AAAAAAA", "BBBB", "CC"] + [None] * 50 + [None] * 50,
"type": ["CDS", "CDS", "CDS"] + ["DR"] * 50 + ["spacer"] * 50,
"start": (
[1050, 3500, 14000, *list(range(10300, 10300 + 66 * 50, 66)), *list(range(10336, 10336 + 66 * 50, 66))]
),
"end": (
[4000, 6000, 16000, *list(range(10336, 10336 + 66 * 50, 66)), *list(range(10366, 10366 + 66 * 50, 66))]
),
"strand": [1, -1, None] + [None] * 50 + [None] * 50,
"color": (
[
"#ffd700",
"#ffcccc",
"#cffccc",
]
+ ["black"] * 50
+ ["red"] * 50
),
"locus_length": [20000] * 103,
"locus_start": [0] * 103,
},
)
ls = []
for i in range(5):
tmpdf = df.copy()
tmpdf.insert(0, "group", str(i) * 4)
if i in (2, 4):
tmpdf["start"] = tmpdf["start"] - 300 * i
tmpdf["end"] = tmpdf["end"] - 300 * i
tmpdf["locus_length"] = tmpdf["locus_length"] - 1500 * i
tmpdf["locus_start"] = 1000
ls.append(tmpdf)
df = pd.concat(ls)
df = df.reset_index(drop=True)
print("=" * 20, "DEMO", "=" * 20)
print(df)
print("=" * 20, "/DEMO", "=" * 20)
return df
if df is None:
if use_demo_data:
df = _get_demo_data()
else:
msg = "Please provide a DataFrame with DNA features."
raise ValueError(msg)
# 设置子图的数量
plt, _, _ = _load_plot_modules()
n = df[col_group].nunique()
# 创建一个n行1列的子图
fig, axs = plt.subplots(n, 1, figsize=(fig_width, fig_height * n))
if n == 1:
# 确保 axs 是一个列表,方便统一处理
axs = [axs]
# 循环遍历每个子图并进行绘图
try:
from dna_features_viewer import GraphicFeature, GraphicRecord
except ImportError:
lm.logger.exception("Please install dna_features_viewer to use this function.")
sys.exit(0)
for i, g in zip(range(n), df.groupby(col_group), strict=False):
group_name, data = g
# print(f"group_name = {group_name}")
features = []
for _, row in data.iterrows():
label = row.get(col_name, None)
if isinstance(label, float):
label = None
start = row.get(col_start, -100)
end = row.get(col_end, 0)
strand = row.get(col_strand, 0)
color = row.get(col_color, "grey")
feature = GraphicFeature(
start=start,
end=end,
strand=strand,
color=color,
label=label,
)
features.append(feature)
if use_demo_data:
locus_start = data["locus_start"].values[0]
locus_length = data["locus_length"].values[0]
else:
locus_start = data[col_locus_start].values[0]
locus_length = data[col_locus_length].values[0]
record = GraphicRecord(
first_index=locus_start,
sequence_length=locus_length,
features=features,
)
# print(axs)
# print(n)
record.plot( # https://github.com/Edinburgh-Genome-Foundry/DnaFeaturesViewer
ax=axs[i],
figure_width=fig_width,
draw_line=kwargs.get("draw_line", True),
with_ruler=kwargs.get("with_ruler", True),
plot_sequence=False,
annotate_inline=kwargs.get("annotate_inline", True),
max_label_length=kwargs.get("max_label_length", 50),
max_line_length=kwargs.get("max_line_length", 20),
level_offset=0,
strand_in_label_threshold="default",
elevate_outline_annotations="default",
figure_height=fig_height,
sequence_params=None,
)
# ax.set_title(f"Subplot {i+1}") # 设置子图的标题
axs[i].set_xlabel(
group_name,
) # 设置x轴标签
# ax.set_ylabel("Y Label") # 设置y轴标签
axs[i].grid(False) # 显示网格线
# plt.show()
plt.tight_layout()
return fig
# 调整子图之间的距离
if __name__ == "__main__":
pass
# test for init_matplotlib
# init_matplotlib(log_level="warning")
# plot_colortable(
# ["#64C1E8", "#80CED7", "#63C7B2", "#8E6C88", "#CA61C3", "#FF958C", "#883677"],
# ncols=1,
# )
# def normal(x, mu, sigma):
# p = 1 / math.sqrt(2 * math.pi * sigma**2)
# return p * np.exp(-0.5 / sigma**2 * (x - mu) ** 2)
# x = np.arange(-7, 7, 0.01)
# params = [(0, 1), (0, 2), (3, 1)]
# plot(
# x,
# [normal(x, mu, sigma) for mu, sigma in params],
# xlabel="x",
# ylabel="p(x)",
# figsize=(4.5, 2.5),
# legend=[f"mean {mu}, std {sigma}" for mu, sigma in params],
# )
# plt.show()
# plt.close()
# df_plot = pd.read_csv("~/demo.tsv", sep="\t")
# # print(df_plot)
# plot_dna_features()
# plot_dna_features(
# df=df_plot,
# # use_demo_data=True
# fig_width=20,
# fig_height=3,
# col_locus_start="locus_start",
# col_locus_length="locus_length",
# col_group="crispr_id:member",
# col_name="pep_name",
# col_start="pep_start",
# col_end="pep_end",
# col_strand="pep_strand",
# col_color="color",
# )
# # fig.savefig("/Users/zhaohuanan/Downloads/test.png", dpi=300)
# # 显示图形
# # plt.show()